Ecommerce is a fast-paced and highly competitive market where customer preferences can shift rapidly and businesses are clawing for every last conversion. This can sometimes force you into making rapid decisions that might not always pan out.
If you want to up your success rate, you should back your decisions up with relevant and up-to-date data. Business-critical information like sales numbers and traffic metrics can help ensure you’re making the right choices and avoiding bad ones.
In this article, we’ll cover both general advice on how to interpret and apply ecommerce data into various areas of company decision-making, and also the practical aspects of setting it up (assuming you haven’t done so already).
If you haven’t already set up ecommerce analytics, we’ve put together a short guide to help you out:
Marketing Analytics at Your Fingertips
Are you intimidated at the prospect of setting up analytics on your online store? Don’t be! Many of the ecommerce platforms currently in the market come pre-loaded with a suite of reports that cover different aspects of your site’s operations.
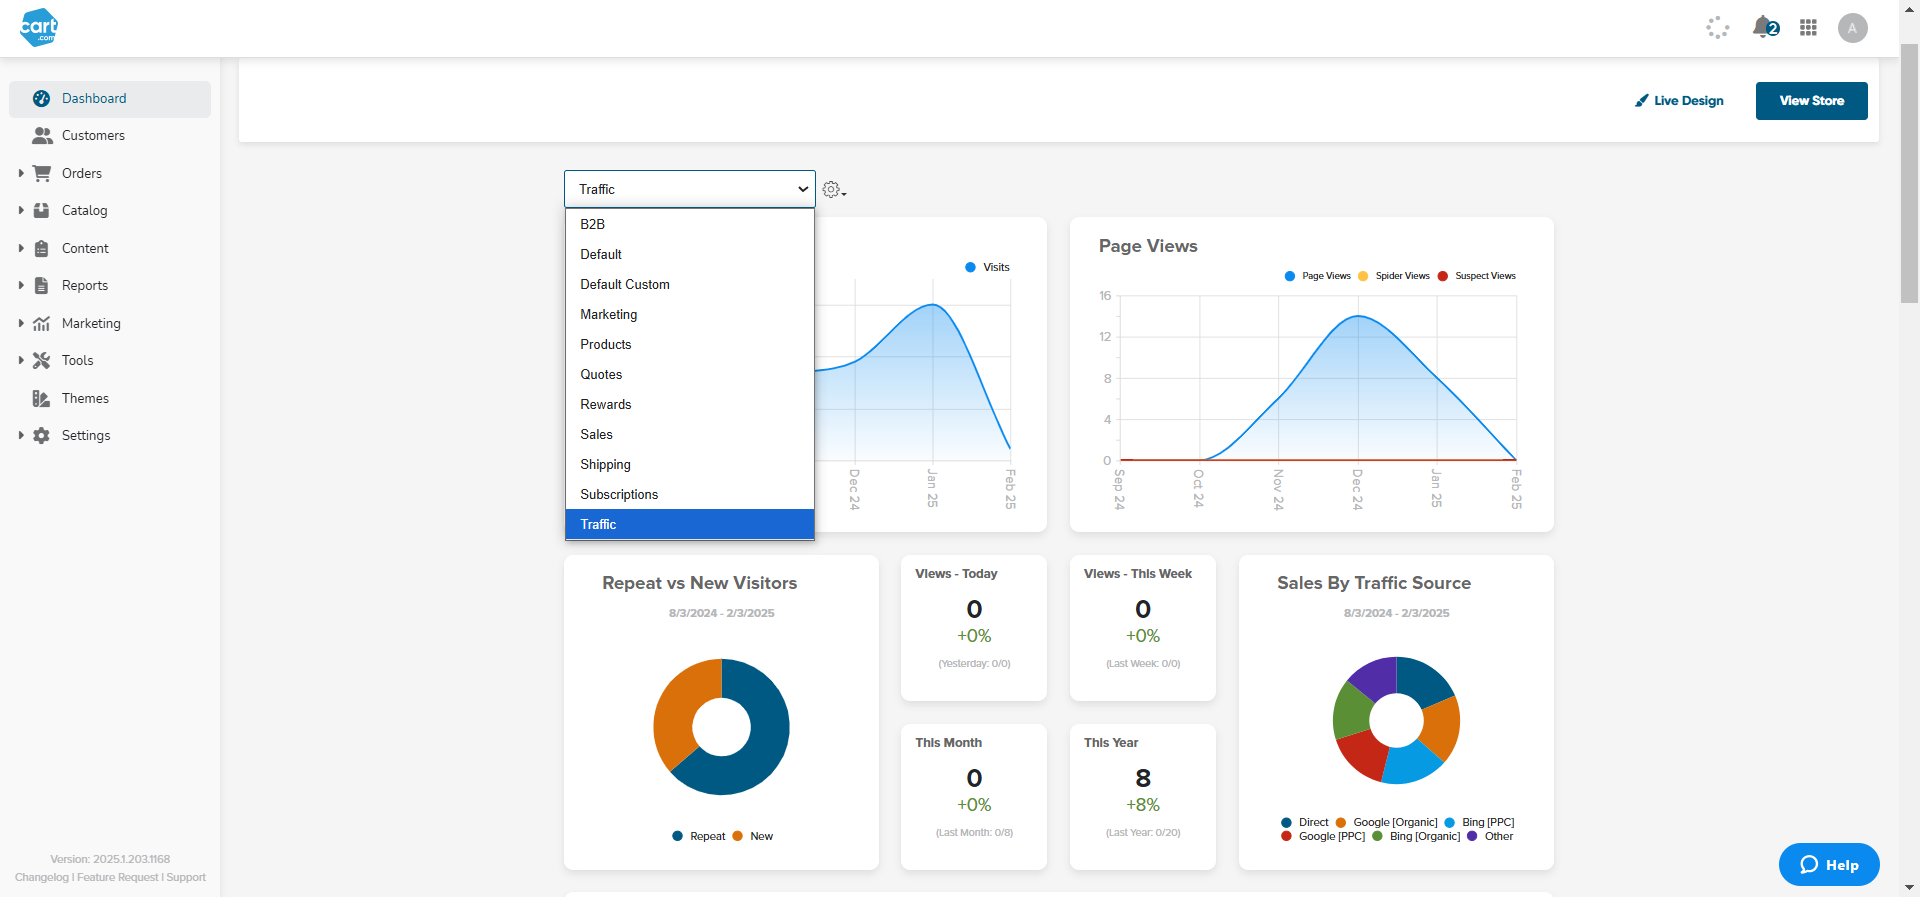
Marketing Dashboard
When you sign into the portal, you'll immediately see our Marketing Dashboard featuring all the essential charts at a glance. The Marketing Dashboard is a collection of pre-built reports, which takes the most critical information of your site and displays it in a convenient, accessible way.
You’ll see charts or graphs of your most popular pages, such as sales, traffic, and more—just by changing your focus on the drop-down menu. It’s a great way for you to view and understand how much you’re earning and where it’s coming from.
If you need more insights, you can still access the PPC Summary, AdCode Summary, and Coupon Code Usage reports under Reports > Marketing Reports > Marketing. There’s still a wealth of valuable information waiting for you in that section.
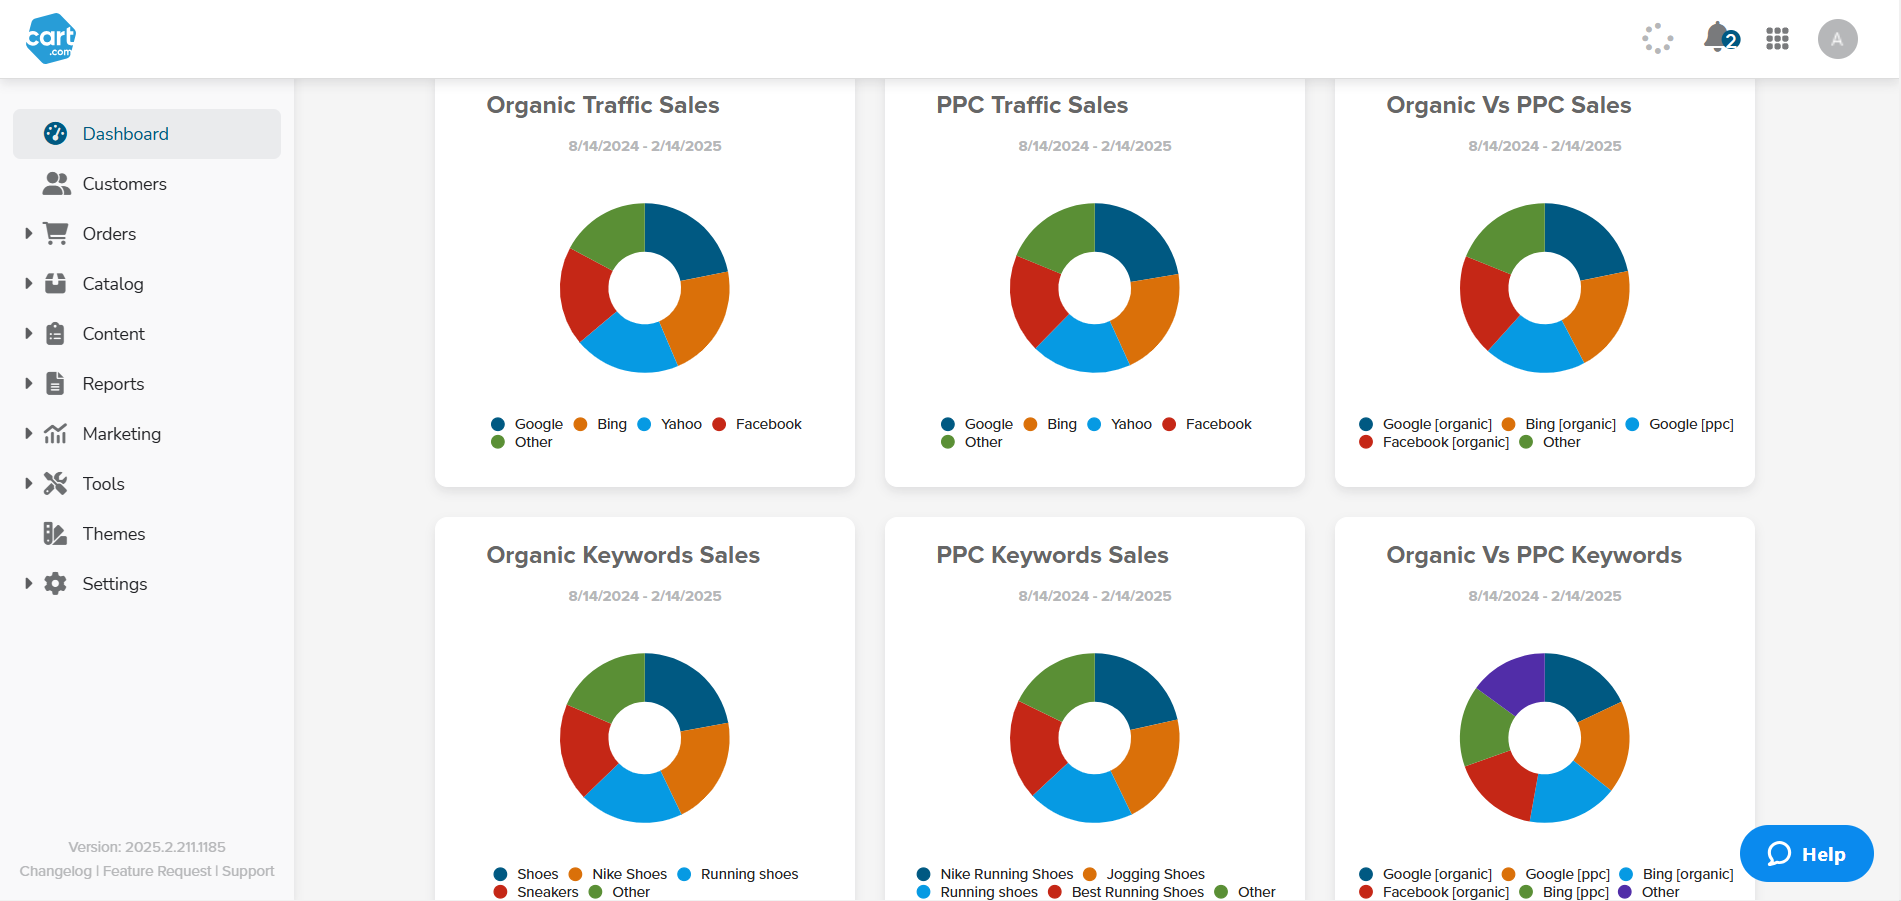
PPC Summary
To access the PPC charts, open the drop-down menu in the Marketing Dashboard and select "Marketing." Furthermore, the PPC Summary report breaks down your PPC performance by source and keywords.
Source tells you the performance of each PPC source, complete with sales and conversion rates that can help you determine your ROI.
Keywords tell you what specific search phrases perform best, so you can tailor your PPC campaign to bring in the most customers and sales.
AdCode Summary
This report gives you sales performance for the various AdCodes configured in your system. Here, you’ll be able to track total sales, visits, and conversion rates for each AdCode.
Coupon Code Usage
If your e-store makes use of coupon codes, you can use this report to find out which coupon codes are being used and to which orders they’ve been applied. You’ll be able to see which codes are most effective in driving sales.
Google Analytics
Google Analytics (GA4) has been a mainstay of online businesses everywhere for years, and for good reason. It’s free, it’s (mostly) accurate, and tracks data based on ecommerce events that you define, which makes it incredibly flexible.
For example, you can set GA4 up to track when users:
- Make a purchase
- Request a refund
- Add/remove items from a cart
- View/select an item
- View/select a promotion
- Begin the checkout process
This plants a seed for a deeper analysis and more informed strategies, which we’ll cover later.
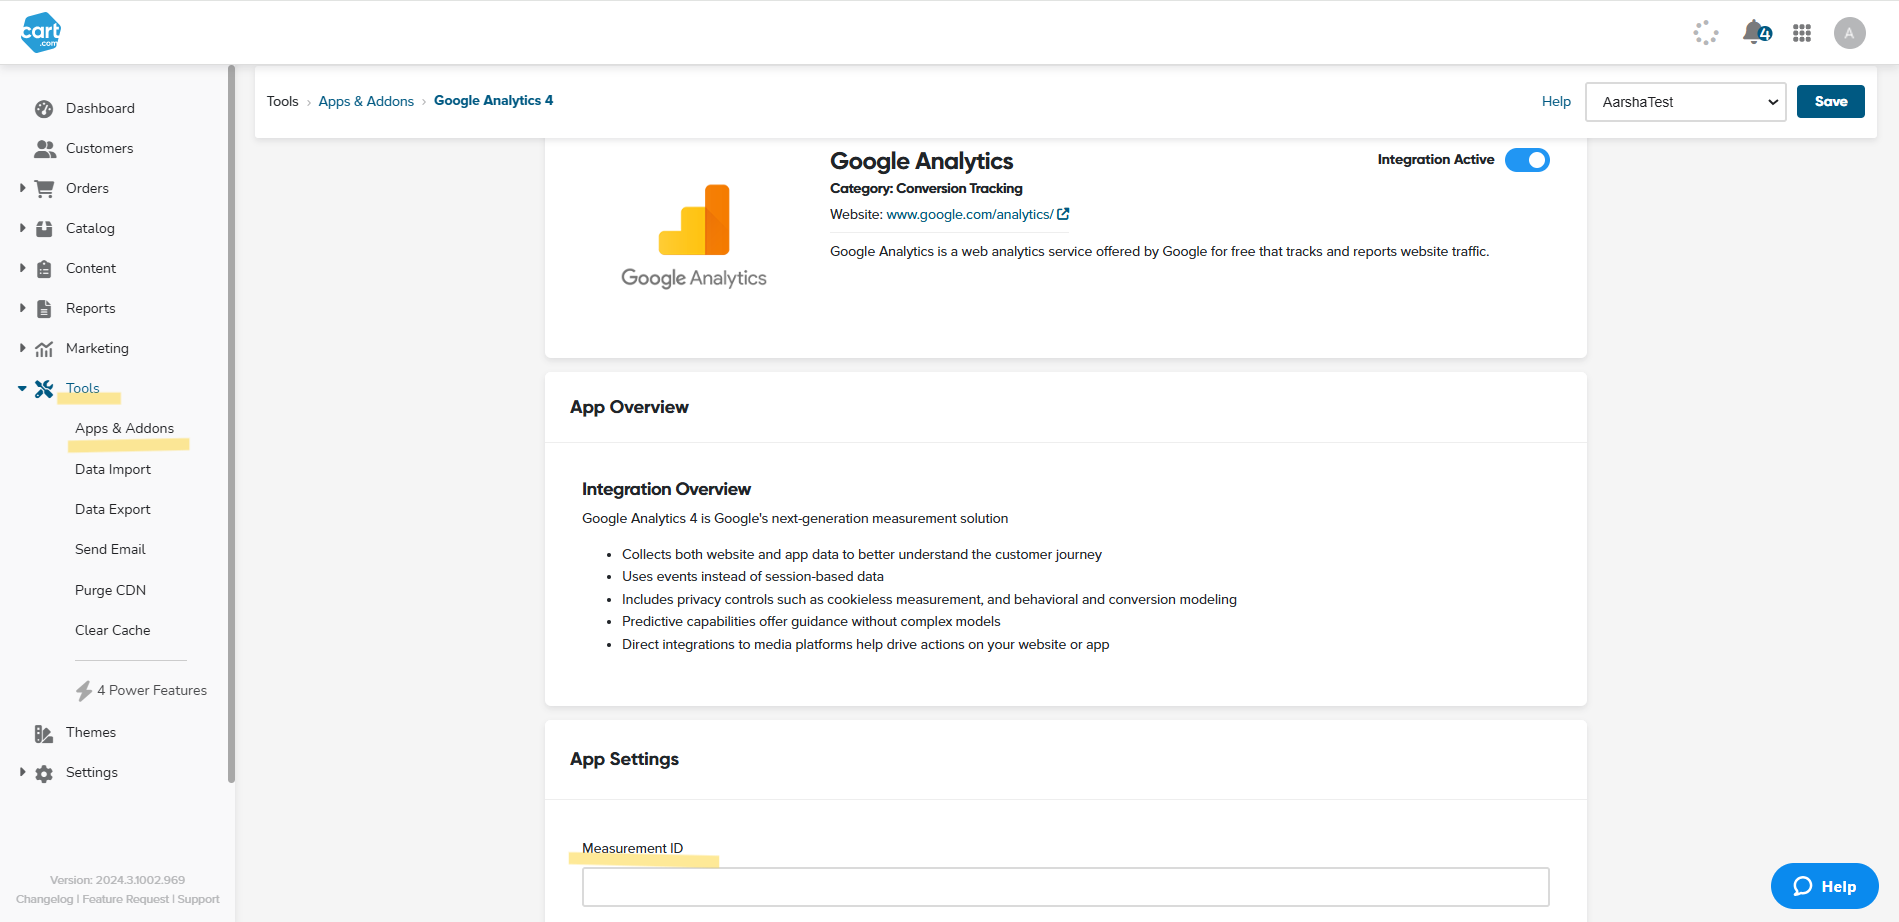
Setting up Google Analytics is a relatively simple process (at least in our B2B Commerce Platform). All you need to do is:
- Go to Tools > Apps & Addons > Google Analytics
- Find the Integration Active slider near the top of the page
- Enable Google Analytics
- Scroll down to the App Settings panel
- Add your Google Measurement ID (“G-” ID)
- Save
For more detailed instructions on how to set up and manage Google Analytics on your account, refer to our knowledge article.
Interpreting Ecommerce Data
So now you’ve got the data streaming in and your reports all set up. Great! But we’re not done yet. You see, it’s not the data itself that’ll influence your business’ success, but how you analyze and interpret it.
It’s possible to look at the same sales and traffic data and get different perspectives— product, customer, and marketing. Also, combining them with secondary and tertiary data points can open up new insights.
Let me demonstrate:
Analyzing Product Performance
Sales data will of course be able to show you how well a product sells, but that’s a shallow observation that won’t help us make hard decisions. We need to go deeper.
Pretend we’re an office supply business. There’s a specific brand of high-quality printer paper that sells well, but we want to know more.
So let’s take product sales and compare it against the date of purchase. Aggregate date of purchase across a year, and you might be able to uncover seasonal sale patterns. Better, but still pretty basic as far as data analysis goes.
But what if we zoom in? Over the course of the month, we see most of the sales bunch up at the start and end of the month. Why is that? Well, it might be that offices prefer to restock their paper supply at month’s end. We don’t know that for sure, but if it’s true, we know that’s a hot time for potential marketing promotions.
We could also look at what other items are purchased along with the paper. Certain items that are often purchased together might be worth selling as a bundle.
Comparing sales against locations can be very beneficial as well. When you’re running a multi-store, knowing where the products were sold or shipped can help you better manage your inventory across different branches/warehouses. You’ll also know which regional promotions to run or how to adjust your stocking strategies.
Unlock Customer Insights
Knowing your customer is basic business sense, and ecommerce is one of the best sources for learning who your customer is (demographics) and what they do (customer behavior).
Google Analytics can tell you a lot about your customers: what area of the world they’re from, how often they visit, and even what kind of devices they use. That last part is especially relevant since there may be a need for you to make your site mobile-friendly. You can also learn more about your customers based on their profiles (if they registered an account). This information can help you market to them better and, to some extent, influence product development.
As mentioned earlier, GA4 also allows you to set up “events” that track when customers do certain actions. Using these events, you’ll be able to uncover what product pages they visit, what buttons they click, and what happens when they get to the checkout page.
This information helps you decide what to improve in order to maximize conversions. If a lot of customers bounce out of a page right away, it might need better copy or images. A high number of abandoned carts might mean you need to either improve your checkout experience or provide better shipping options.
Analyze Marketing Performance
You’re probably using all sorts of tactics to increase your store’s visibility and reach: PPC ads, email campaigns, and social media promotions. That’s a hefty investment, and you want to make sure that’s paying off.
You can use the data in the marketing reports you’ve set up to judge the effectiveness of your campaigns. For example, the PPC Summary report in our B2B Commerce Platform can help you optimize your ad campaigns moving forward, (e.g. adjusting bids on high-performing keywords) while the Coupon Code report can identify which discounts are attracting the most customers and for which products.
You can even see how your most loyal customers are redeeming their Rewards Points and decide whether or not that loyalty program needs to be reworked.
Integrating Third-Party Analytics Tools
As helpful as the built-in reports are, they are admittedly somewhat limited. After all, the primary purpose of an ecommerce platform is to facilitate product sales, not report on data. That’s what services like GA4 do; but not even Google Analytics can show everything—or show it in the most helpful way.
If you find yourself in need of more data to analyze, or need the data visualized in a different way, then try a third-party analytics tool.
However, every third-party analytics tool is different, and that includes how they’ll be integrated into your platform. It’s best to engage their customer support or implementation team to ensure it’s set up properly.
Strategic Decisions Demand Data-Driven Insights
There’s a lot that goes into important strategic decisions, such as market research, ICPs, and corporate direction. But there’s simply no substitute for first-party data. It’s the equivalent of cooking with fresh ingredients. The information is current and it represents actual buyer behavior (instead of something corporate assumes will happen based on their image of the customer).
It doesn’t matter what decision you’re trying to make—fresh data will help.
Product Development
Looking to improve your product line? You can identify trends and customer preferences by paying close attention to the sales data. Also try hosting informational content like case studies, blogs, and videos to track which gets more views.
If you want to uncover product gaps, then check your on-site search. What are people searching for? Are there any items you don’t offer? What happens when they can’t find what they want? Also check the bounce rates—specifically for pages that have a lot of visitors but a lot of bounces, too. That may be a sign they don’t like what they see. You just have to figure out why.
Customer Retention
Data, when leveraged properly, can do wonders for improving customer loyalty. For instance, you can combine GA4’s customer demographics and the collected behavioral data to highly targeted marketing campaigns that will have a higher chance of drawing repeat buyers.
Our platform can help you put together a loyalty program where members shop using accumulated points instead of cash, as well as offering them member-only deals, shipping discounts, and product bundles.
Marketing Strategies
Ecommerce data doesn’t just help you retain customers; it can also help you acquire new ones. You can use the insights generated from watching your existing customers to help improve lead generation campaigns like email marketing, social media, and paid advertising for better targeting and engagement.
You can also try to optimize conversions on your webstore by conducting A/B tests of small improvements over time. Test different CTAs, new product photos or copy, and even experiment with site navigation. Every percentage point you gain is an incremental boost that will eventually add up to large gains.
Leverage the Power of Data
Data that is properly collected, organized, and analyzed can transform the way you run your ecommerce business. With it, you can make more informed tactical and strategic decisions that can increase customer satisfaction, attract more leads, and drive business growth.
If you’d like to know more about how Cart.com’s B2B Commerce Platform collects and presents data for you and your team, reach out to one of our experienced ecommerce specialists and we'll answer all of your questions.